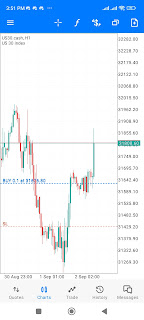
US30 (DOW JONES/ WALLSTREET 30) MARKET ANALYSIS

US30 price dropped to a key H1 demand level at 29120.82 & 28837.20 which also corresponds with a major weekly demand level. Price dropped to demand, formed candle close inside followed by a large H1 bullish engulfing candle and a rally out of demand confirming a bullish reversal. Price formed candle close above demand, retested it then continued with the rally, rallying to the 1st H1 high at 29589.90 confirming a shift in market structure to bullish. However, price has still not yet taken out that H1 high and I anticipated a drop back to retest demand and accumulate more bullish orders to take out the H1 high and continue with the rally. I missed out on the optimum entries at the start of the rally but looking to take buy positions after a retracement back to demand.